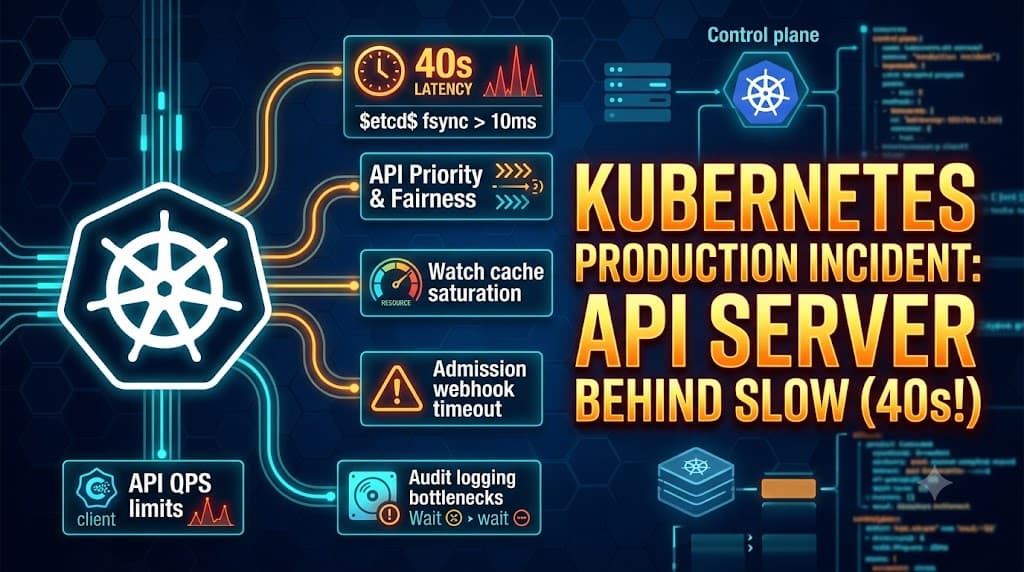
The Incident
Everything looked normal. Applications were running. Pods were healthy. Nodes were reporting Ready.
Then someone ran: kubectl get pods
Instead of returning immediately, the command just hung.
After almost 40 seconds:
NAME                         READY   STATUS    RESTARTS   AGE
api-service-7d8f9c7c-abc12   1/1     Running   0          2h
worker-6f7b8c9d-def34        1/1     Running   0          2h
The application itself wasn't obviously down. But the Kubernetes control plane had become painfully slow.
Soon, other operations started showing the same symptoms:
kubectl get nodes
kubectl get deployments
kubectl describe pod <pod>
kubectl apply -f deployment.yaml
kubectl delete pod <pod>
Some commands took seconds. Others took tens of seconds. Some requests timed out completely.
This is a classic Kubernetes production incident:
The API server is reachable, but it's no longer responding at normal latency.
The important question is:
Why?
There are several layers that can cause this behavior, and the API server is often only the place where the problem becomes visible.
In this article, we'll investigate six common causes:
- etcd latency
- API Priority and Fairness
- Watch cache saturation
- Admission webhook timeouts
- Audit logging bottlenecks
- API QPS and burst limits
| Bottleneck Area | Primary Metric / Log Signal | Quick Triage Command / Focus |
| etcd Latency | etcd_disk_wal_fsync_duration_seconds (>10ms) | Check etcd disk I/O and network RTT |
| API Priority & Fairness | apiserver_flowcontrol_rejected_requests_total | Check queued vs. dropped requests in APF |
| Watch Cache Saturation | apiserver_cache_list_fetched_objects_total | Look for unindexed LIST calls bypassing cache |
| Admission Webhooks | apiserver_admission_webhook_admission_latencies_seconds | Query mutating/validating webhooks timing out |
| Audit Logging | High CPU/Disk I/O on API Server nodes | Verify AuditSink mode (blocking vs. non-blocking) |
| API QPS Limits | client_loopback_throttled_request_total | Check client-side qps and burst configurations |
1. Understand the Request Path
Before troubleshooting, understand what happens when you execute:
kubectl get podsA simplified request path looks like this:
kubectl
   |
   v
Kubernetes API Server
   |
   +---- Authentication
   |
   +---- Authorization
   |
   +---- API Priority & Fairness
   |
   +---- Admission
   |
   +---- Watch Cache / Storage
   |
   v
etcd
Depending on the request, additional components can become involved:
                    +----------------+
                    |    kubectl     |
                    +-------+--------+
                            |
                            v
                  +---------+----------+
                  |    API Server      |
                  +---------+----------+
                            |
          +-----------------+------------------+
          |                 |                  |
          v                 v                  v
       APF Queue       Admission Webhooks   Audit
          |                 |                  |
          |                 v                  v
          |            Webhook Service     Audit Backend
          |
          v
     Watch Cache
          |
          v
         etcd
The key lesson is:
Slow API requests do not automatically mean the API server process itself is CPU-starved.
The API server may be waiting on another component.
2. Start With the Symptoms
Before changing anything, establish exactly what is slow.
Try several API operations:
time kubectl get pods -Atime kubectl get nodestime kubectl get namespacestime kubectl get deployments -AAlso test a request that doesn't require retrieving a large resource list:
time kubectl versionand:
time kubectl get --raw='/readyz?verbose'If almost every API request is slow, suspect a control-plane-wide issue. If only specific resources are slow, investigate the resource type, its storage path, watches, or admission configuration.
3. Check API Server Health
Start with the API server itself.
kubectl get pods -n kube-systemLook for the API server pods:
kubectl get pods -n kube-system \
  -l component=kube-apiserver
Then check readiness:
kubectl get --raw='/readyz?verbose'You want the individual checks to report healthy.
Also inspect API server logs:
kubectl logs -n kube-system \
  -l component=kube-apiserver \
  --tail=200
Look for messages involving:
etcd
timeout
request
webhook
admission
audit
flowcontrol
throttling
watch
At this point, don't restart the API server just because requests are slow.
First identify where the latency is coming from.
4. Suspect #1: etcd Latency
Why etcd matters
Kubernetes stores its cluster state in etcd.
That includes objects such as:
- Pods
- Deployments
- Services
- ConfigMaps
- Secrets
- Nodes
- CRDs
- Leases
- RBAC objects
The API server depends heavily on etcd.
If etcd becomes slow, API operations can become slow as well.
The request path can look like:
kubectl
   |
   v
API Server
   |
   v
etcd
   |
   X
High latency
What can make etcd slow?
Common causes include:
Disk I/O problems
etcd is sensitive to storage latency.
A control-plane node experiencing high disk latency can cause etcd requests to slow down significantly.
Large database size
An excessively large etcd database can increase maintenance and compaction pressure.
Defragmentation requirements
Fragmentation can increase the physical storage footprint and affect performance.
Resource contention
If the same node is overloaded with CPU, memory, or I/O-heavy workloads, etcd can suffer.
Network latency
In an HA control plane, communication between etcd members matters.
Check etcd health
If you have access to etcd tooling:
etcdctl endpoint healthYou can also inspect endpoint status:
etcdctl endpoint status --cluster -w tableLook at:
- endpoint health
- leader status
- database size
- raft term
- raft index
- response latency
Depending on your Kubernetes distribution, the exact method for accessing etcd may differ.
What to look for
If API server latency increases at the same time as etcd request latency, etcd becomes a strong suspect.
Conceptually:
API request latency
        |
        +------> increases
        |
etcd request latency
        |
        +------> increases
That's much more useful than simply looking at API server CPU usage.
5. Suspect #2: API Priority and Fairness
Another possible cause is API Priority and Fairness, commonly abbreviated as APF.
APF controls how API requests are classified and queued. This becomes especially important in busy clusters.
Imagine the API server receiving:
1000 requests/sec
       |
       v
+----------------------+
| Kubernetes API Server|
+----------------------+
       |
       v
+----------------------+
| Priority & Fairness  |
+----------------------+
       |
       +---- High priority
       |
       +---- Normal priority
       |
       +---- Low priority
If one client or workload generates a huge number of requests, APF can prevent that traffic from consuming all available API server capacity.
But under heavy load, requests can spend time waiting in queues.
How to investigate APF
Look at the API Priority and Fairness objects:
kubectl get flowcontrolDepending on your Kubernetes version, you can inspect:
kubectl get prioritylevelconfigurationand:
kubectl get flowschemaThe important question is:
Are requests waiting in APF queues before they are actually processed?
API server metrics are particularly useful here.
Look for metrics related to:
apiserver_flowcontrol and request waiting/queue behavior.Why this can look like an API server problem
Suppose the API server has enough CPU.
You might think:
"The API server isn't overloaded."
But requests can still be waiting.
The flow may actually be:
Request
   |
   v
APF
   |
   |  waiting in queue
   v
API handler
   |
   v
Storage
So CPU utilization alone isn't enough to diagnose API latency.
6. Suspect #3: Watch Cache Saturation
Kubernetes makes extensive use of watches.
Controllers don't constantly ask:
"What's the current state?"
"What's the current state?"
"What's the current state?"
Instead, they can watch for changes.
The API server maintains caches for many resources to make reads and watches more efficient.
A simplified model looks like:
etcd
  |
  v
API Server
  |
  v
Watch Cache
  |
  +---- Controllers
  +---- kubectl
  +---- Operators
When the cluster becomes very busy, the watch/cache path can become stressed.
What can cause watch pressure?
Large clusters can have:
- many controllers
- many operators
- thousands of resources
- large numbers of CRDs
- frequent object updates
- many concurrent watches
A particularly noisy controller can generate a huge amount of activity.
For example:
Pod update
Pod update
Pod update
Pod update
Pod update
...
Multiply that by many resources and many watchers and the API server can become busy processing watch traffic.
Signs of watch-related pressure
Look at API server metrics related to:
watch
cache
LIST
WATCH
Also look for workloads generating unusually high update rates.
Useful commands include:
kubectl get --raw='/metrics' | grep -i watchand:
kubectl get --raw='/metrics' | grep -i cacheThe exact metrics available depend on your Kubernetes version.
A useful clue
If ordinary GET requests seem fine but list/watch-heavy workloads are experiencing problems, investigate the watch/cache path carefully.
This is especially important in clusters with many custom controllers and operators.
7. Suspect #4: Admission Webhook Timeout
This is one of the most common causes of surprisingly slow API requests.
Admission webhooks can intercept API requests.
For example:
kubectl apply
      |
      v
API Server
      |
      v
Admission Webhook
      |
      v
Webhook Service
If that webhook is slow, the API request can become slow.
A simple example
Imagine a validating webhook normally responds in:
20 msEverything is fine. Then something happens to the webhook:
Webhook response time:
20 ms
50 ms
500 ms
2 sec
5 sec
timeout
Now API requests that invoke the webhook may experience the same delay.
What should you check?
List webhooks:
kubectl get validatingwebhookconfigurationsand:
kubectl get mutatingwebhookconfigurationsInspect suspicious configurations:
kubectl describe validatingwebhookconfiguration <name>and:
kubectl describe mutatingwebhookconfiguration <name>Look at:
timeoutSecondsfailurePolicy- service references
- namespace selectors
- object selectors
- rules
Check the webhook service
Find the service referenced by the webhook:
kubectl get svc -AThen inspect its endpoints:
kubectl get endpoints -Aor, on newer clusters:
kubectl get endpointslices -AYou may discover:
Webhook Service
      |
      +---- Pod 1   Healthy
      |
      +---- Pod 2   Not Ready
      |
      +---- Pod 3   CrashLoopBackOff
The webhook itself may be the real problem.
Important lesson
A broken webhook can make a healthy-looking API server appear broken.
When investigating API latency, always ask:
Does this API operation trigger an admission webhook?
8. Suspect #5: Audit Logging Bottlenecks
Audit logging is another area that can contribute to API server performance problems.
The API server can generate audit events for API requests.
Conceptually:
Client
  |
  v
API Server
  |
  +---- Process request
  |
  +---- Generate audit event
             |
             v
        Audit Backend
In a high-traffic cluster, the number of audit events can become very large.
For example:
10,000 requests/sec
        |
        v
Large audit event volume
        |
        v
High CPU / I/O / network usage
What can make audit logging expensive?
Potential factors include:
- very high API request volume
- verbose audit policies
- large request/response bodies
- slow audit backends
- disk I/O
- network logging destinations
- excessive event volume
The exact performance characteristics depend heavily on the audit configuration and Kubernetes version.
What to investigate
Review your API server audit configuration.
Look at:
audit-policy.yamlCheck whether the policy is logging an unexpectedly large amount of information.
Also inspect API server logs and metrics related to audit processing.
The key question is:
Did audit event volume increase at the same time API latency increased?
If yes, audit logging deserves serious investigation.
9. Suspect #6: API QPS and Burst Limits
Sometimes the API server isn't actually "slow." Your client may simply be throttling itself.
This is especially common with:
- automation
- CI/CD systems
- custom controllers
- operators
- scripts
- large-scale deployments
Kubernetes clients commonly use QPS and burst settings.
For example, a client might effectively behave like:
Allowed:
10 requests/sec
Burst:
20 requests
If the application suddenly needs to make hundreds of requests, it may spend time waiting for its client-side rate limiter.
How this appears
You might see:
kubectl:        slow
API server:     healthy
etcd:           healthy
Webhook:        healthy
The actual problem may be:
Client-side throttlingrather than API server performance.
Look for throttling messages
Controllers and clients may log messages similar to:
Waited for ...
request.go:...
Throttling request took ...
Search controller logs:
kubectl logs -n kube-system <controller-pod>Also inspect the configuration of custom controllers and operators.
10. Don't Forget API Server Metrics
When debugging Kubernetes control-plane performance, metrics are often more useful than guessing.
If metrics are available:
kubectl get --raw='/metrics'You can filter API server metrics:
kubectl get --raw='/metrics' | grep apiserverUseful categories include:
apiserver_request_duration_seconds
apiserver_request_total
apiserver_current_inflight_requests
apiserver_flowcontrol
The exact metric names and availability can change between Kubernetes releases.
11. A Practical Troubleshooting Workflow
When:
kubectl get pods takes 40 seconds, don't immediately restart components. Use a structured process.Step 1 — Confirm the problem
time kubectl get pods -AThen compare:
time kubectl get nodes
time kubectl get namespaces
time kubectl get deployments -A
Determine whether the problem affects:
- one resource
- one namespace
- one API group
- all API requests
Step 2 — Check API server health
kubectl get --raw='/readyz?verbose'Then inspect API server logs:
kubectl logs -n kube-system \
  -l component=kube-apiserver \
  --tail=200
Step 3 — Check etcd
Check:
etcd health
etcd latency
disk latency
CPU
memory
database size
leader status
If etcd is slow, fix etcd before tuning the API server.
Step 4 — Check APF
Inspect:
kubectl get prioritylevelconfiguration
kubectl get flowschema
Look for:
queueing
waiting requests
high request volume
misclassified traffic
Step 5 — Check admission webhooks
kubectl get validatingwebhookconfigurations
kubectl get mutatingwebhookconfigurations
Investigate:
timeouts
unhealthy webhook pods
network connectivity
slow webhook responses
Step 6 — Check watch/cache pressure
Look at API server metrics for:
LIST
WATCH
cache
watch events
request latency
Investigate controllers generating unusually high update rates.
Step 7 — Check audit logging
Determine whether:
API request volume increasedand:
audit event volume increasedat the same time.
Step 8 — Check client-side throttling
Look for:
QPS
burst
client-side rate limiting
especially in:
- operators
- controllers
- CI/CD
- automation scripts
12. The Troubleshooting Decision Tree
Here's a simple way to approach the incident.
kubectl request is slow
          |
          v
Is everything slow?
     /          \
   YES           NO
    |             |
    v             v
Check API      Check the
server health  specific resource
    |
    v
Is etcd slow?
   /     \
 YES      NO
  |        |
  v        v
Fix etcd  Check APF
           |
           v
      Queueing delays?
        /       \
      YES        NO
       |          |
       v          v
    Check APF   Check webhooks
                   |
                   v
             Webhook timeout?
                /       \
              YES        NO
               |          |
               v          v
          Fix webhook   Check watch/cache
                           |
                           v
                     Check audit + QPS
The goal isn't to check everything randomly.
The goal is to eliminate entire classes of problems quickly.
13. What Not to Do During the Incident
Production incidents often cause people to make changes too quickly.
Avoid blindly doing things like:
systemctl restart kubelet or deleting API server pods without understanding the cause.Also avoid randomly changing:
- API server flags
- etcd configuration
- webhook timeouts
- APF configuration
- audit policy
- client QPS
without evidence.
You may temporarily make the symptoms disappear while making the underlying problem worse.
14. A Better Mental Model
When the Kubernetes API server becomes slow, think in layers.
                Kubernetes API Latency
                         |
       +-----------------+------------------+
       |                 |                  |
       v                 v                  v
     Client          API Server         Backend
       |                 |                  |
       |                 +---- APF           +---- etcd
       |                 |                  |
       |                 +---- Admission    +---- Disk
       |                 |                  |
       |                 +---- Audit        +---- Network
       |                 |
       |                 +---- Watch Cache
       |
       +---- QPS/Burst
This prevents tunnel vision.
The API server is the entry point, not necessarily the root cause.
15. The Most Important Lesson
When:
kubectl get podstakes 40 seconds, don't immediately conclude:
"The Kubernetes API server is overloaded."
Instead ask:
Where is the request spending those 40 seconds?
It could be:
Client-side throttling
        ↓
APF queue
        ↓
Admission webhook
        ↓
API server processing
        ↓
Watch cache
        ↓
etcd
        ↓
Disk / network
The latency you're seeing at the command line is the final symptom.
Your job during the incident is to find the layer responsible for the delay.
16. Final Takeaway
A slow Kubernetes API server can be one of the most frustrating production incidents because almost everything appears to depend on it.
Deployments become slow.
Controllers fall behind.
Autoscaling decisions can be delayed.
Operators may start reporting errors.
CI/CD pipelines can time out.
And engineers suddenly can't trust even a simple:
kubectl get podsThe good news is that API server latency is usually diagnosable if you approach it systematically.
Start with the request path.
Then investigate:
- etcd latency
- API Priority and Fairness
- watch cache pressure
- admission webhook latency
- audit logging
- client/API QPS limits
Most importantly:
Don't treat the API server as an isolated component. Kubernetes control-plane performance is a chain, and latency anywhere in that chain can surface as a slow
kubectlcommand.
Once you learn to identify where the request is waiting, a mysterious 40-second kubectl command becomes a much more manageable production debugging problem.
Quick Reference
Check API server readiness
kubectl get --raw='/readyz?verbose'Check API server metrics
kubectl get --raw='/metrics' | grep apiserverCheck API server pods
kubectl get pods -n kube-system \
  -l component=kube-apiserver
Check webhooks
kubectl get validatingwebhookconfigurations
kubectl get mutatingwebhookconfigurations
Check APF
kubectl get prioritylevelconfiguration
kubectl get flowschema
Test API latency
time kubectl get pods -ACheck etcd
etcdctl endpoint health
etcdctl endpoint status --cluster -w table